> ## Documentation Index
> Fetch the complete documentation index at: https://docs.codeflash.ai/llms.txt
> Use this file to discover all available pages before exploring further.
# Extension Features
> Complete guide to VS Code extension features: inline suggestions, sidebar panel, and optimization workflow
# Extension Features
The Codeflash VS Code extension provides a seamless optimization experience with inline suggestions, a dedicated sidebar panel, and multiple ways to select and optimize functions.
***
## Inline Optimization Suggestions (CodeLens)
The extension shows **"optimize"** hints directly above functions that can be optimized:
```python theme={null}
# optimize ← Click this to start optimization
def process_data(items):
result = []
for item in items:
if item > 0:
result.append(item * 2)
return result
```
**How it works:**
1. Open any Python file in your project
2. The extension analyzes your code automatically
3. Functions that can be optimized show an "optimize" hint above them
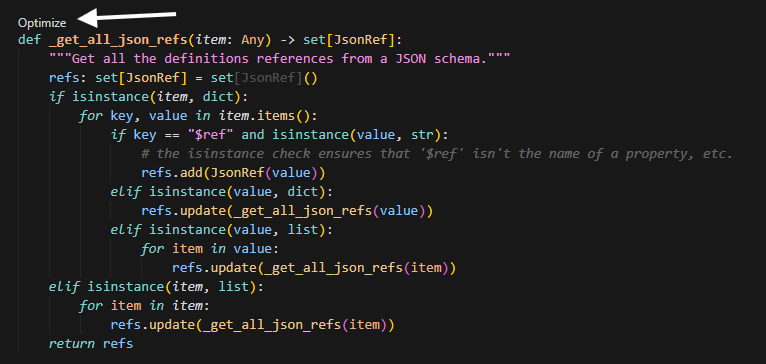 4. Click the hint to start optimization
Look for CodeLens hints above functions in your editor for quick optimization
access.
Functions must be inside your configured `module-root` directory to show
optimization hints. Check your `pyproject.toml` if hints aren't appearing.
***
## Sidebar Panel Overview
Access the Codeflash sidebar by clicking the Codeflash icon in the Activity Bar (left side of your editor).
The sidebar has two main tabs:
* **Optimization** — Select files and functions to optimize, or use quick actions
* **Tasks** — View and manage your optimization queue and completed optimizations
***
## Optimization Tab
The **Optimization** tab is your main interface for selecting code to optimize. It provides several ways to start optimizing:
### File and Function Selection
4. Click the hint to start optimization
Look for CodeLens hints above functions in your editor for quick optimization
access.
Functions must be inside your configured `module-root` directory to show
optimization hints. Check your `pyproject.toml` if hints aren't appearing.
***
## Sidebar Panel Overview
Access the Codeflash sidebar by clicking the Codeflash icon in the Activity Bar (left side of your editor).
The sidebar has two main tabs:
* **Optimization** — Select files and functions to optimize, or use quick actions
* **Tasks** — View and manage your optimization queue and completed optimizations
***
## Optimization Tab
The **Optimization** tab is your main interface for selecting code to optimize. It provides several ways to start optimizing:
### File and Function Selection
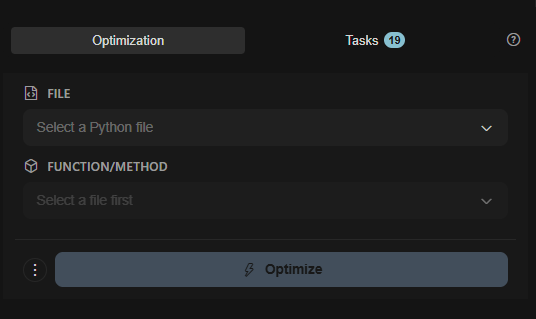 At the top of the Optimization tab, you'll find two dropdown selectors:
1. **FILE** — Select a Python file from your workspace
* Click the dropdown to browse and select a Python file
* The placeholder shows "Select a Python file" until you make a selection
2. **FUNCTION/METHOD** — Select a specific function to optimize
* This dropdown is disabled until you select a file first
* Once a file is selected, it populates with all optimizable functions (qualified names)
* Functions are displayed with their fully qualified names (e.g., `MyClass.my_method` or `module.function_name`)
3. **Optimize Button** — Click the **Optimize** button (with lightning bolt icon) to queue the selected function for optimization
**Qualified Names** — Functions are displayed with their fully qualified
names, making it easy to identify the exact function you want to optimize,
including class methods and nested functions.
### Quick Action Cards
Below the file/function selectors, you'll find two action cards for common optimization workflows:
#### Optimize Current File
* **Icon:** Lightning bolt
At the top of the Optimization tab, you'll find two dropdown selectors:
1. **FILE** — Select a Python file from your workspace
* Click the dropdown to browse and select a Python file
* The placeholder shows "Select a Python file" until you make a selection
2. **FUNCTION/METHOD** — Select a specific function to optimize
* This dropdown is disabled until you select a file first
* Once a file is selected, it populates with all optimizable functions (qualified names)
* Functions are displayed with their fully qualified names (e.g., `MyClass.my_method` or `module.function_name`)
3. **Optimize Button** — Click the **Optimize** button (with lightning bolt icon) to queue the selected function for optimization
**Qualified Names** — Functions are displayed with their fully qualified
names, making it easy to identify the exact function you want to optimize,
including class methods and nested functions.
### Quick Action Cards
Below the file/function selectors, you'll find two action cards for common optimization workflows:
#### Optimize Current File
* **Icon:** Lightning bolt
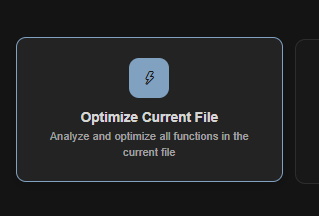 * **Action:** Analyze and optimize all functions in the currently opened file
* **How to use:** Click the card to optimize all functions in the active editor tab
Optimizing all functions in a large file may take time. The extension will
show you the count of functions and ask for confirmation before proceeding.
#### Optimize Changed Code
* **Icon:** Git diff symbol (intertwined links)
* **Action:** Analyze and optimize all functions in the currently opened file
* **How to use:** Click the card to optimize all functions in the active editor tab
Optimizing all functions in a large file may take time. The extension will
show you the count of functions and ask for confirmation before proceeding.
#### Optimize Changed Code
* **Icon:** Git diff symbol (intertwined links)
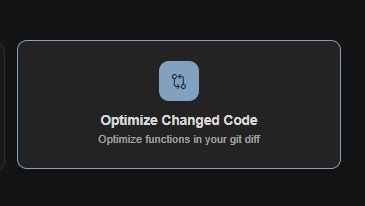 * **Action:** Optimize functions in your Git diff
* **How to use:** Click the card to automatically detect and optimize all modified functions in your current Git changes
This is perfect for optimizing code you've just changed before committing. The
extension will only optimize functions that are part of your current changes.
### Getting Started Section
When you first open the Optimization tab, you'll see a "Ready to Optimize" section with:
* A brief description: "AI-powered Python optimization with automatic testing & benchmarking"
* A **View Documentation** button to access help and guides
***
## Tasks Tab
The **Tasks** tab shows your optimization queue and completed optimizations. Switch to this tab to:
* View all queued optimizations
* Track progress of running optimizations
* Review completed optimizations
### Empty State
When you haven't started any optimizations yet, the Tasks tab shows:
* A rocket icon
* "No optimizations yet" message
* Instructions: "Add functions to the queue by clicking the small optimize button above a function"
### Completed Optimizations
Once optimizations complete, you'll see a list showing:
* **Action:** Optimize functions in your Git diff
* **How to use:** Click the card to automatically detect and optimize all modified functions in your current Git changes
This is perfect for optimizing code you've just changed before committing. The
extension will only optimize functions that are part of your current changes.
### Getting Started Section
When you first open the Optimization tab, you'll see a "Ready to Optimize" section with:
* A brief description: "AI-powered Python optimization with automatic testing & benchmarking"
* A **View Documentation** button to access help and guides
***
## Tasks Tab
The **Tasks** tab shows your optimization queue and completed optimizations. Switch to this tab to:
* View all queued optimizations
* Track progress of running optimizations
* Review completed optimizations
### Empty State
When you haven't started any optimizations yet, the Tasks tab shows:
* A rocket icon
* "No optimizations yet" message
* Instructions: "Add functions to the queue by clicking the small optimize button above a function"
### Completed Optimizations
Once optimizations complete, you'll see a list showing:
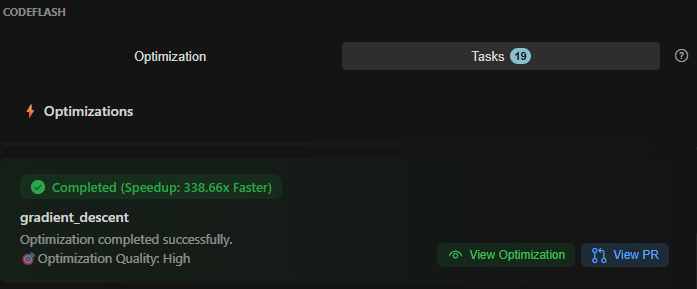 * **Function Name** — The name of the optimized function
* **Status Badge** — Shows completion status with speedup information:
* "Completed (Xx Faster)" — Displays the performance improvement
* Example: "Completed (2.5x Faster)" or "Completed (Speedup: 338.66x Faster)"
* **Optimization Quality** — Some optimizations show quality ratings (e.g., "Optimization Quality: High")
* **Actions:**
* **View Optimization** button — Opens the diff view to see changes and apply them
* **View PR** button — Opens the associated pull request (if optimization was created via PR)
The Tasks tab shows a badge count (e.g., "Tasks 19") indicating how many
optimization tasks you have in total.
***
## Optimization Workflow
Once you've selected functions to optimize (via any method above), here's what happens:
Selected functions are added to the optimization queue. You can see them in
the Tasks tab.
Watch the Tasks tab for real-time updates: - Generating optimization
candidates - Running tests to verify correctness - Benchmarking performance
When complete, you'll see the optimization in the Tasks tab with: - Speedup
information (e.g., "2.5x Faster") - Optimization quality rating - **View
Optimization** button to see the diff
Click **View Optimization** to see the full diff, then **Accept** to apply
the optimization, or **Reject** to dismiss it.
***
## Reviewing Optimizations
After an optimization completes, you can review it in the Tasks tab or via inline comments.
* **Function Name** — The name of the optimized function
* **Status Badge** — Shows completion status with speedup information:
* "Completed (Xx Faster)" — Displays the performance improvement
* Example: "Completed (2.5x Faster)" or "Completed (Speedup: 338.66x Faster)"
* **Optimization Quality** — Some optimizations show quality ratings (e.g., "Optimization Quality: High")
* **Actions:**
* **View Optimization** button — Opens the diff view to see changes and apply them
* **View PR** button — Opens the associated pull request (if optimization was created via PR)
The Tasks tab shows a badge count (e.g., "Tasks 19") indicating how many
optimization tasks you have in total.
***
## Optimization Workflow
Once you've selected functions to optimize (via any method above), here's what happens:
Selected functions are added to the optimization queue. You can see them in
the Tasks tab.
Watch the Tasks tab for real-time updates: - Generating optimization
candidates - Running tests to verify correctness - Benchmarking performance
When complete, you'll see the optimization in the Tasks tab with: - Speedup
information (e.g., "2.5x Faster") - Optimization quality rating - **View
Optimization** button to see the diff
Click **View Optimization** to see the full diff, then **Accept** to apply
the optimization, or **Reject** to dismiss it.
***
## Reviewing Optimizations
After an optimization completes, you can review it in the Tasks tab or via inline comments.
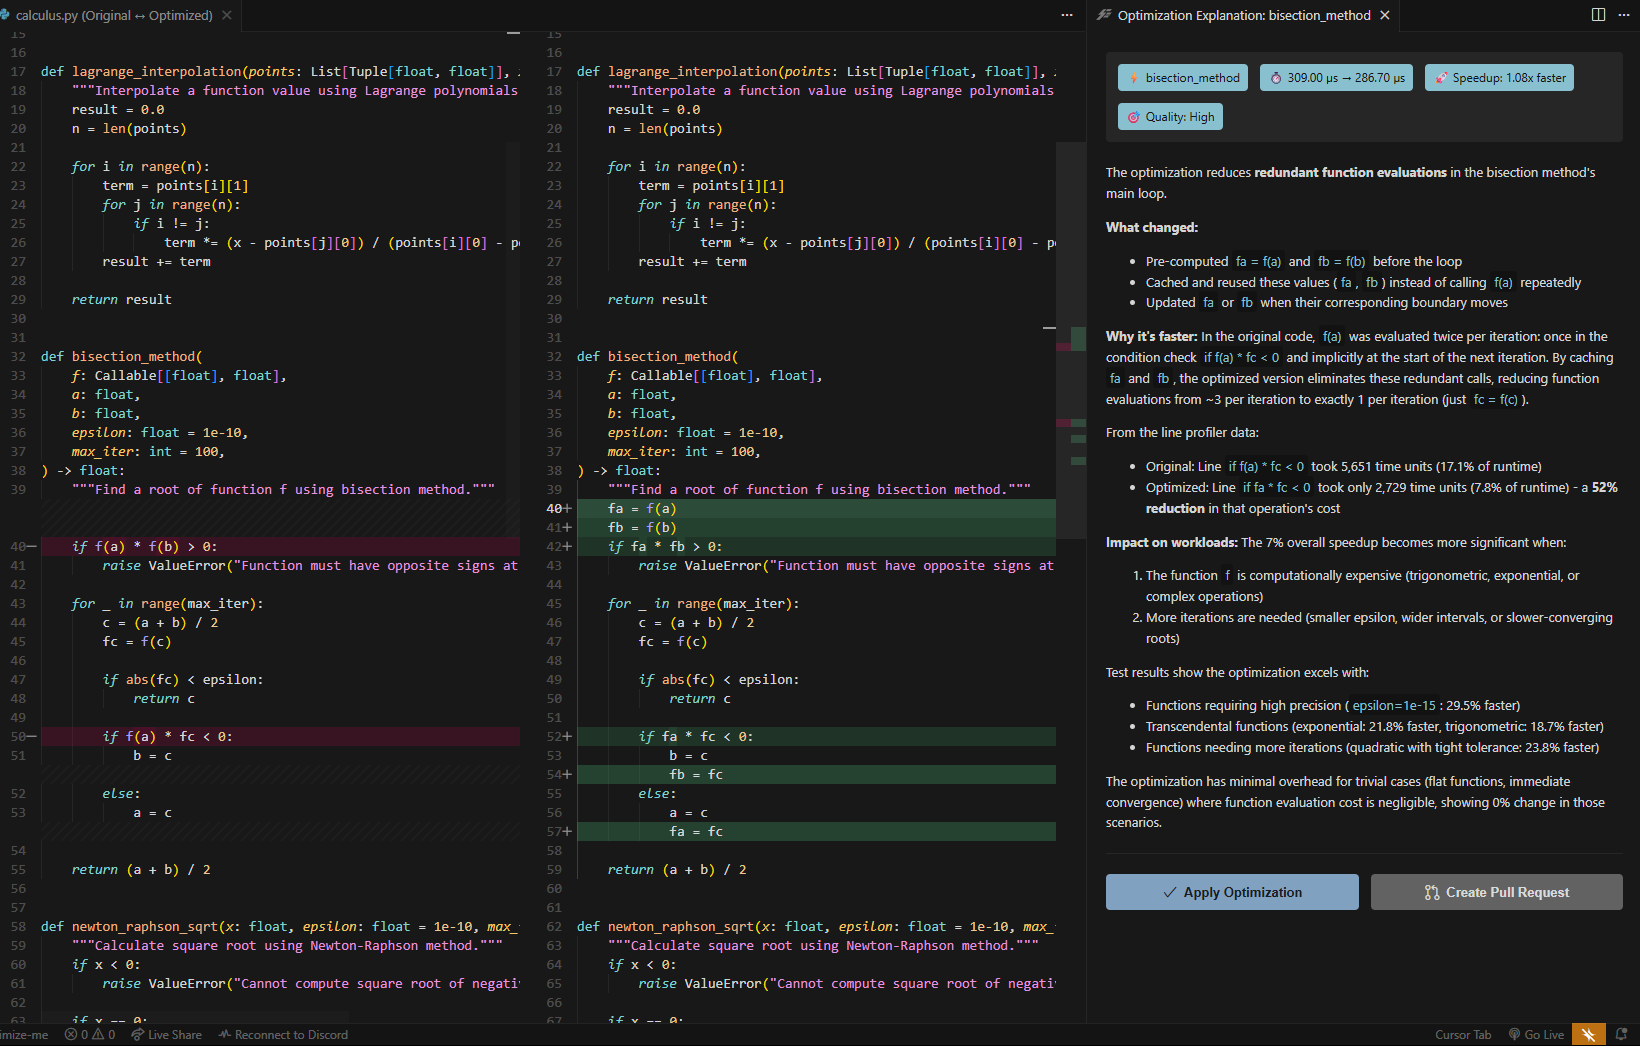 ### In the Tasks Tab
Click **View Optimization** on any completed optimization to see:
* Side-by-side comparison of original vs. optimized code
* Performance improvement percentage (speedup)
* Runtime comparison (original vs. optimized)
* Optimization quality rating
* Detailed explanation of what changed and why
* **Apply Optimization** button to accept the changes
### Inline Comments
The extension also shows inline comments on the optimized function in your editor with options to:
* **View Patch** — See the full diff of changes
* **Accept** — Apply the optimization to your code
* **Reject** — Dismiss the suggestion without changes
***
## Next Steps
Customize extension settings
Fix common issues
### In the Tasks Tab
Click **View Optimization** on any completed optimization to see:
* Side-by-side comparison of original vs. optimized code
* Performance improvement percentage (speedup)
* Runtime comparison (original vs. optimized)
* Optimization quality rating
* Detailed explanation of what changed and why
* **Apply Optimization** button to accept the changes
### Inline Comments
The extension also shows inline comments on the optimized function in your editor with options to:
* **View Patch** — See the full diff of changes
* **Accept** — Apply the optimization to your code
* **Reject** — Dismiss the suggestion without changes
***
## Next Steps
Customize extension settings
Fix common issues