

- Python
- JavaScript / TypeScript
- Java
To optimize a script, You can also optimize code called by pytest tests:
python myscript.py, simply replace python with codeflash optimize:codeflash optimize command creates high-quality optimizations, making it ideal when you need to optimize a workflow or script. The initial tracing process can be slow, so try to limit your script’s runtime to under 1 minute for best results.
The generated replay tests and the trace file are for the immediate optimization use, don’t add them to git.
Codeflash optimize 1 min demo
What is the codeflash optimize command?
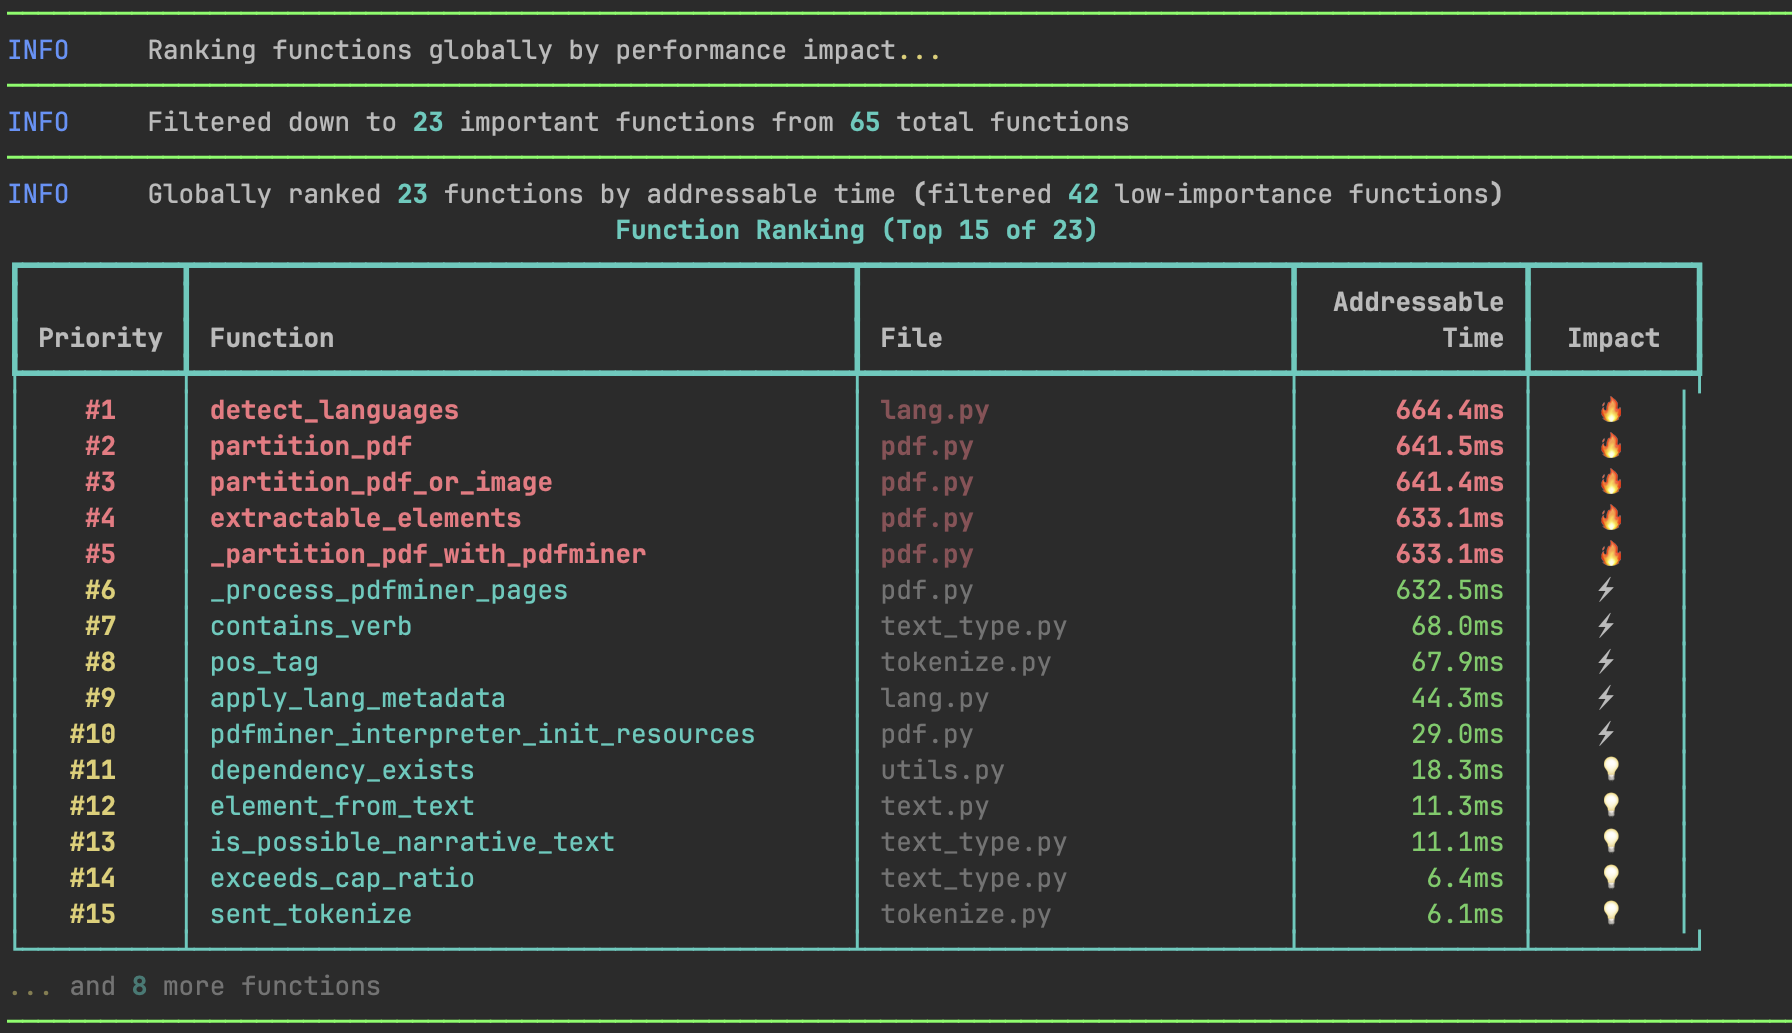
codeflash optimize tries to do everything that an expert engineer would do while optimizing a workflow. It profiles your code, traces the execution of your workflow and generates a set of test cases that are derived from how your code is actually run.
Codeflash Tracer works by recording the inputs of your functions as they are called in your codebase, and generating
regression tests with those inputs.
We call these generated test cases “Replay Tests” because they replay the inputs that were recorded during the tracing phase.
These replay tests are representative of the real-world usage of your functions.
Using Replay Tests, Codeflash can verify that the optimized functions produce the same output as the original function and also measure the performance gains of the optimized function on the real-world inputs.
This way you can be sure that the optimized function causes no changes of behavior for the traced workflow and also, that it is faster than the original function. To get more confidence on the correctness of the code, we also generate several LLM generated test cases and discover any existing unit cases you may have.
Using codeflash optimize
- Python
- JavaScript / TypeScript
- Java
Codeflash script optimizer can be used in three ways:
-
As an integrated command
If you run a Python script as follows
You can start tracing and optimizing your code with the following commandThe above command should suffice in most situations. To customize the trace file location you can specify it like
codeflash optimize --output trace_file_path.trace. Otherwise, it defaults tocodeflash.tracein the current working directory. -
Trace and optimize as two separate steps
If you want more control over the tracing and optimization process. You can trace first and then optimize with the replay tests later. Each replay test is associated with a trace file.
To create just the trace file first, run
This will create a replay test file. To optimize with the replay test, run theMore Options:
--timeout: The maximum time in seconds to trace the entire workflow. Default is indefinite. This is useful while tracing really long workflows.
-
As a Context Manager
To trace only specific sections of your code, you can use the Codeflash Tracer as a context manager.
You can wrap the code you want to trace in a
withstatement as follows:This is much faster than tracing the whole script. It can also help if tracing the whole script fails. After this finishes, you can optimize using the generated replay tests.More Options for the Tracer Context Manager:disable: If set toTrue, the tracer will not trace the code. Default isFalse.max_function_count: The maximum number of times to trace a single function. More calls to a function will not be traced. Default is 100.timeout: The maximum time in seconds to trace the entire workflow. Default is indefinite. This is useful while tracing really long workflows, to not wait indefinitely.output: The file to save the trace to. Default iscodeflash.trace.config_file_path: The path to thepyproject.tomlfile which stores the Codeflash config. This is auto-discovered by default. You can also disable the tracer in the code by setting thedisable=Trueoption in theTracerconstructor.